ABSTRACT
-
Purpose
Biliary atresia (BA) is a rare but progressive cholangiopathy and the leading cause of pediatric liver transplantation worldwide. The Korean Association of Pediatric Surgeons (KAPS) has conducted three national surveys (2001, 2011, and 2023) to assess long-term trends in the diagnosis, treatment, and outcomes of BA. This study provides a comparative analysis of the 2nd and 3rd national surveys, with reference to selected findings from the 1st survey.
-
Methods
This study included 453 patients from the 3rd national survey (2011–2021) and 435 patients from the 2nd survey (2001–2010), all of whom underwent Kasai portoenterostomy. Data were collected via electronic case report forms from pediatric surgical centers nationwide. Comparisons were made regarding demographics, clinical features, diagnostic patterns, operative details, follow-up outcomes, and survival. Kaplan–Meier analysis was used to evaluate long-term survival.
-
Results
The mean number of BA patients per year remained stable between surveys (43.5 in the 2nd, 41.18 in the 3rd), though centralization of care increased, with 61.5% of cases managed by two major institutions in the 3rd survey. The median age at surgery decreased, and the use of preoperative imaging (especially magnetic resonance cholangiopancreatography) increased. The 10-year native liver survival rate declined from 59.8% to 53.7%, while overall 10-year survival improved slightly (92.9% to 93.2%). Postoperative complications, such as cholangitis and liver failure, persisted but were better categorized. The 3rd survey also reported improved mortality (4.9%) and reduced follow-up loss (11.5%) compared to the 2nd survey.
-
Conclusion
While overall survival after Kasai operation has remained high and even improved, native liver survival has slightly declined. The findings reflect earlier diagnosis, more consistent diagnostic imaging, and increasing centralization of care. These trends underscore the importance of long-term nationwide data collection in guiding future strategies for BA management in Korea.
-
Keywords: Biliary atresia; Kasai procedure; Hepatoportoenterostomy; Liver transplantation; Surveys
INTRODUCTION
Biliary atresia (BA) is a rare but severe cholangiopathy causing progressive fibrosis and obstruction of bile ducts, often leading to liver failure if untreated. It is the most common indication for pediatric liver transplantation (LT) [
1,
2]. Since the introduction of the Kasai portoenterostomy and pediatric LT, outcomes have improved significantly [
1]. However, the etiology of BA remains unclear [
2].
BA incidence varies geographically and is higher in Asia than in Western countries [
2,
3]. To understand national trends in Korea, the Korean Association of Pediatric Surgeons (KAPS) has conducted three national surveys—each establishing benchmarks for BA diagnosis, management, and outcomes.
This study compares the findings of the second (2001–2010) and third (2011–2021) KAPS national surveys, incorporating selected data from the first (1980–2000), with a focus on clinical features, diagnostic patterns, surgical management, and long-term outcomes. The 2023 annual nationwide survey conducted by the KAPS focused on BA. The results were first discussed at the KAPS annual meeting in Skybay Hotel Gyeongpo, Gangneung on June 8–9, 2023.
METHODS
This study was based on the third national survey on BA conducted by KAPS. Data from 453 patients treated from 2011 to 2021 were collected from pediatric surgical centers using standardized electronic case report forms (eCRFs). The inclusion criterion was a diagnosis of BA (ICD-10 code Q442) with surgical intervention.
An eCRF was used to collect data from participating institutions. The eCRF system facilitated the collection of detailed patient information, including demographics, surgical outcomes, and long-term follow-up results. The data were analyzed using R statistical software (version 4.0.2; R Foundation for Statistical Computing, Vienna, Austria).
This study aimed to compare the results of the third survey with those of the previous two national surveys conducted in 2001 and 2011, focusing on changes in BA incidence, surgical outcomes, and long-term prognosis. The survey results were analyzed using statistical methods to assess trends over time and identify factors influencing patient outcomes.
The first KAPS national survey on BA, conducted in 2001, covered a 21-year period from 1980 to 2000, involving 26 KAPS members working in 18 pediatric surgical centers in Korea. The results were published in the
Journal of the Korean Association of Pediatric Surgeons in 2002 [
4]. The second KAPS national survey on BA, conducted in 2011, covered a 10-year period from 2001 to 2010, involving 24 KAPS members from 18 pediatric surgical centers in Korea. The results were published in the
Journal of the Korean Association of Pediatric Surgeons in 2013 [
5].
The study protocol was approved by the Institutional Review Board (IRB) of Jeonbuk National University Hospital (IRB No. 2022-06-033).
RESULTS
1. Demographics
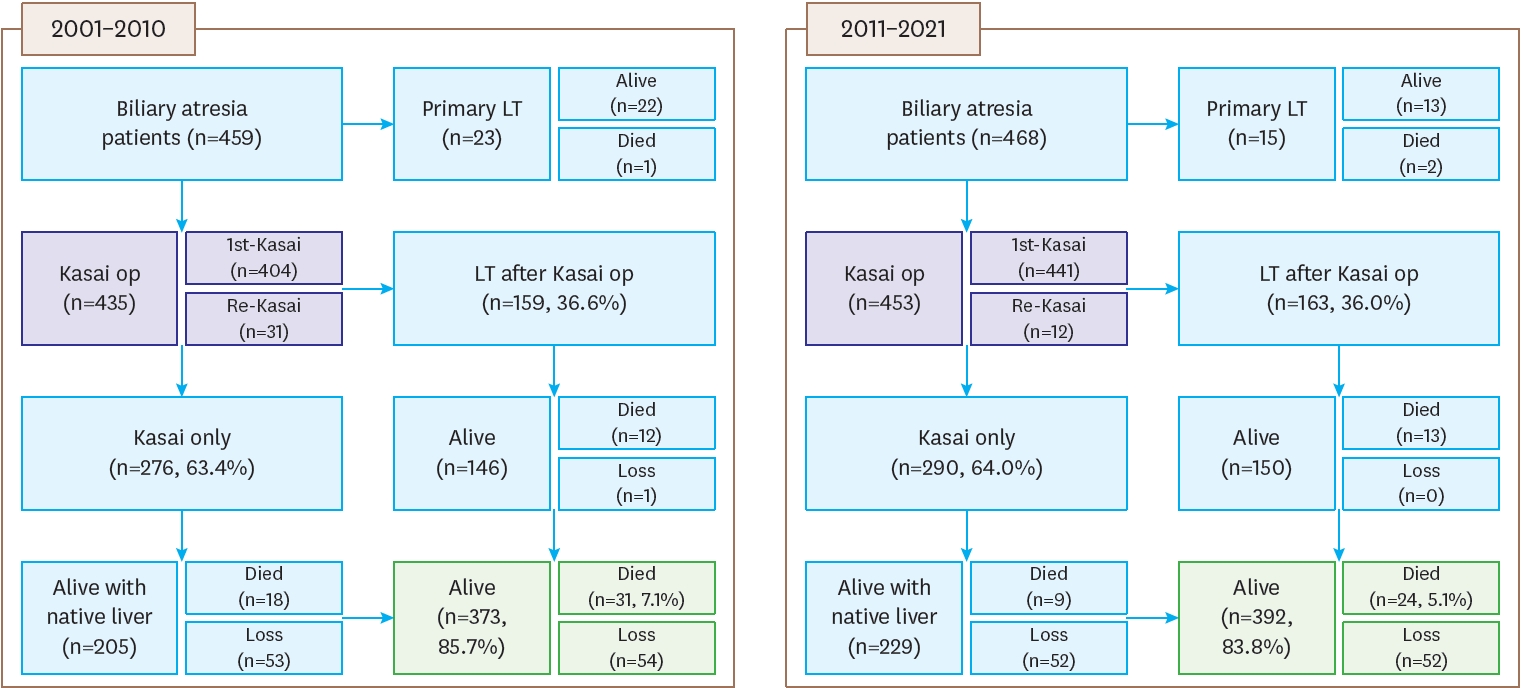
The registered patients in the second and third surveys can be summarized as follows. A flowchart of BA patients, including data on primary LT, compares the results from the second survey (2001–2010) with the third survey (2011–2021). In the second survey, there were 459 patients, of whom 404 underwent their first Kasai operation, and 159 patients (36.6%) received a liver transplant after the Kasai operation. Among these patients, 276 (63.4%) only underwent the Kasai procedure. Re-Kasai procedures were performed in 31 cases. By the end of the follow-up, 373 patients (85.7%) were alive, 31 (7.1%) had died, and 54 were lost to follow-up. In the third survey, there were 468 patients, with 441 undergoing their first Kasai operation. Among these, 163 patients (36.0%) received a liver transplant after the Kasai operation, while 290 (64.0%) only underwent the Kasai procedure. Re-Kasai procedures were performed in 12 cases. By the end of the follow-up, 392 patients (83.8%) were alive, 24 (5.1%) had died, and 52 were lost to follow-up. Additionally, 23 patients received primary LT in the second survey (22 alive, 1 died), compared to 15 in the third survey (13 alive, 2 died) (
Fig. 1).
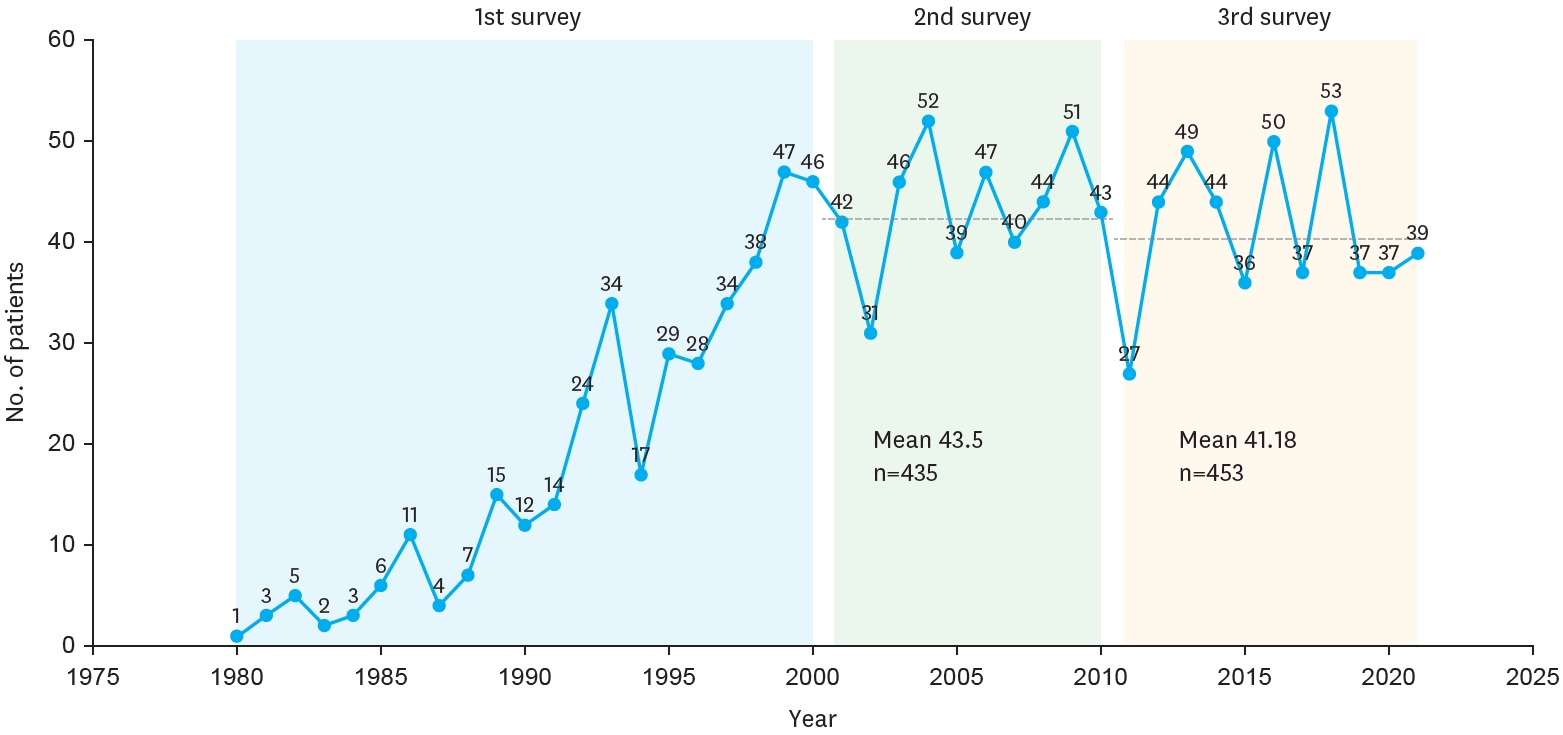
The yearly distribution of patients is depicted in the figure, showing the number of BA cases registered each year from 1980 to 2021. During this period, the number of patients varied annually, with notable increases observed in certain years. In 1980, only 1 patient was registered, whereas the number steadily grew in the following years, reaching a peak of 53 patients in 2018. The first survey indicated an overall increasing trend in patient numbers, while the second and third surveys showed relatively stable patterns with slight fluctuations. The mean number of patients was 43.5 in the second survey and 41.18 in the third survey (
Fig. 2A). In addition,
Table 1 shows the estimated prevalence of BA among live births in Korea, based on data from national surveys by the KAPS.
The comparison of hospital distribution between the second and third surveys reveals significant centralization of BA cases across institutions. In the second survey, 18 medical institutions participated, but this number decreased to 15 in the third survey. Additionally, the proportion of cases managed by two primary hospitals increased from 49.0% in the second survey to 61.5% in the third survey. The average number of patients per hospital also rose, with a mean of 23.8 patients in the second survey compared to 29.8 patients in the third. This trend reflects the centralization of care for BA patients, with a greater proportion of cases being treated at fewer, specialized institutions over time (
Fig. 3).
The demographics and characteristics of BA patients were analyzed across three survey periods conducted by the KAPS: 1980–2000, 2001–2010, and 2011–2021. The male-to-female ratio was relatively consistent across the surveys, at 0.77, 0.68, and 0.70, respectively. Gestational age data, first available in the second survey, showed a mean of 38.8 weeks, slightly decreasing to 38.4 weeks in the third survey. The mean birth weight was 3.08 kg in the second survey and 3.05 kg in the third. Apgar scores, recorded only in the third survey, averaged 7.28 at one minute, 8.46 at five minutes, and 9.00 at ten minutes post-birth. In terms of parental age, the third survey recorded an average maternal age of 32.93 years and paternal age of 35.87 years. The occurrence of associated anomalies among BA patients decreased over time, from 22.5% in the first survey to 16.3% in the second, and 10.8% in the third. Within these anomalies, cardiovascular issues were the most common, found in 5.9% of patients in the first survey, 8.42% in the second, and 6.84% in the third. Other notable anomalies included gastrointestinal issues, which decreased from 6.25% in the first survey to 2.65% in the third, and splenic malformations, which showed a slight decrease from 2.81% in the first survey to 1.55% in the third. New categories recorded in the third survey included central nervous system anomalies (0.66%), pulmonary anomalies (0.66%), chromosomal anomalies (0.66%), and biliary anomalies (1.10%). This progression highlights shifts in the demographics and associated anomalies of BA patients in Korea over the past few decades (
Table 2).
Across the three national surveys for BA, jaundice remained the most common symptom, though it slightly decreased over time. In the first survey (1980–2000), jaundice was present in 98.4% of patients, which decreased to 94.3% in the second survey (2001–2010) and 92.1% in the third survey (2011–2021). The presence of acholic stool initially declined but then rose slightly in the third survey, with 86.2% of patients showing this symptom in the first survey, dropping to 62.1% in the second, and rising to 66.0% in the third survey. The rates of hepatomegaly and abdominal distension showed significant reductions over time. Hepatomegaly was noted in 48.4% of patients in the first survey, decreasing to 7.7% in the second and further to 5.8% in the third. Similarly, abdominal distension was recorded in 24.4% of cases in the first survey, reduced to 6.44% in the second, and was not recorded in the third survey. These decreases may reflect less thorough physical examinations in more recent years. Laboratory findings at admission showed improved values over the surveys, likely due to earlier diagnosis. Average total bilirubin levels decreased from 10.1 mg/dL in the second survey to 8.7 mg/dL in the third, while direct bilirubin declined from 6.7 mg/dL to 6.2 mg/dL. Gamma-glutamyl transferase, aspartate aminotransferase, and alanine aminotransferase levels also showed slight declines from the second to the third survey, suggesting less severe disease progression by the time of testing. Preoperative diagnostic practices evolved considerably. Ultrasound (US) use increased from 96.8% in the second survey to 97.6% in the third, with an emphasis on early identification of key indicators. Hepatobiliary scans rose from 68.1% in the second survey to 70.6% in the third, while magnetic resonance cholangiopancreatography (MRCP) utilization grew significantly, from 45.0% to 61.4%, indicating a greater reliance on non-invasive imaging. Liver biopsy use also increased slightly, from 27.1% in the second survey to 29.6% in the third, reflecting a continued, though selective, reliance on histopathology for diagnosis. This comparison suggests evolving trends in both clinical presentations and diagnostic practices. The decrease in severe laboratory values and the increased use of diagnostic imaging may reflect shifts toward earlier diagnosis and an evolving approach to preoperative assessment (
Table 3).
In the third survey (2011–2021), the mean age of patients undergoing surgery was 61.0 days, with a median age of 62 days (ranging from 6 to 199 days). This was a slight reduction from the second survey, where the mean age was 66.2 days. Notably, 13.9% of patients underwent surgery at 30 days or younger, and the largest group (42.2%) had surgery between 61 and 90 days. Only 2.7% of patients had surgery after 120 days, showing a decrease in delayed surgeries compared to earlier surveys. The use of operative cholangiograms increased significantly, being performed in 71.7% of cases in the third survey, compared to 52.9% in the second survey, indicating a growing reliance on this diagnostic tool during surgery. The size of the microscopic bile ducts was also examined, with 61.2% of patients in the third survey having ducts measuring 150 μm or less, compared to 41.7% in the second survey. This indicated an increase in the proportion of smaller ducts. For the type of reconstruction, the original Roux-en-Y (Kasai I) procedure was the most common method, performed in 97.3% of cases in the third survey, similar to 99.8% in the second survey. A small percentage (0.9%) of patients had a Roux-en-Y with valve. Other procedures, such as double Roux-en-Y or gallbladder Kasai, were rarely used. Hepatic portoduodenostomy was performed in 0.4% of cases. Finally, the mean operation time in the third survey was 255.5 minutes, indicating the typical length of the surgery for BA during this period (
Table 4).
In the third survey (2011–2021), postoperative findings for BA patients revealed several trends. The average discharge date was on postoperative day (POD) 29.2, slightly earlier than the second survey (2001–2010), which reported an average discharge on POD 31.5. The first time to feed post-surgery was noted at an average of 4.14 days.
Stool color was observed as an indicator of biliary function, with bile-stained stool appearing in 85.0% of cases and acholic (pale) stool in 11.0%. The average day for the first bile-stained stool was recorded at 6.43 days post-surgery. Discharge medications varied between surveys. In the third survey, 54.53% of patients received oral antibiotics, a decrease from 72.3% in the second survey. The use of oral steroids increased to 52.76% from 40.8%, and ursodeoxycholic acid remained common, prescribed to 94.92% of patients. Other medications included phenobarbital (29.6%), tocopherol (48.6%), and Alvityl multivitamins (82.1%). Re-admission rates showed an increase, with 68.9% of patients re-admitted in the third survey compared to 61.8% in the second survey. The most common cause of re-admission was cholangitis, occurring in 59.7% of cases, followed by varices (7.6%) and ascites (6.0%). Redo operations were performed in 2.7% of cases in the third survey, up from 1.1% in the second survey. Late complications were reported in 49.3% of cases in the third survey, showing a decrease from 70.4% in the second survey. Among these complications, cholangitis episodes during follow-up occurred in 33.0% of cases, while liver cirrhosis or liver failure was observed in 28.0%. Variceal bleeding occurred in 9.9% of cases, while CMV infection was reported in 7.0%. This analysis highlights important trends in postoperative outcomes, medication use, and complications, with some variations observed between the second and third national surveys (
Table 5).
The follow-up outcomes after Kasai operation for BA patients were reported across three national surveys by the KAPS. In the first survey (1980–2000), follow-up data were collected using a different methodology, which limits direct comparison with subsequent surveys. Although 195 patients were reported alive after Kasai, detailed classifications regarding postoperative status were not provided. The overall mortality rate was 27.4%, and the follow-up loss rate was 19.7%. In the second survey (2001–2010), of the 435 patients included, 276 (63.4%) underwent only the Kasai operation. Among them, 74.3% were alive at follow-up, with 124 patients having no complications and 81 showing postoperative issues. The mortality rate for the Kasai-only group was 6.5%, and 19.2% were lost to follow-up. Meanwhile, 159 patients (36.6%) underwent LT after Kasai, with an average interval of 1.1 years. Among this group, 91.8% survived, and 7.5% died. In the third survey (2011–2021), 290 out of 453 patients (64.0%) received only the Kasai procedure. The survival rate in this group increased to 79.0%, with 102 patients having no complications and 127 presenting with postoperative problems. The mortality rate decreased to 3.1%, and the follow-up loss rate improved to 11.5%. A total of 163 patients (36.0%) underwent LT, with an average interval of 1.6 years after Kasai. Among these, 92.0% survived and 8.0% died, with no follow-up loss reported. In summary, while the 1st survey provides foundational data, its different data classification method limits direct comparisons. However, the 2nd and 3rd surveys demonstrate consistent improvements in survival rates, a decrease in follow-up loss, and better outcomes in both Kasai-only and post-transplant groups (
Table 6).
The Kaplan–Meier survival analysis was conducted to evaluate both native liver survival and overall survival after Kasai portoenterostomy in BA patients, using data from the second (2001–2010) and third (2011–2021) national surveys by the KAPS. In the second survey comprising 435 patients, the 10-year native liver survival rate was 59.8%, while the 10-year overall survival rate—including those who underwent LT—was 92.9%. The mean postoperative follow-up period was 3.4±2.8 years (range: 0–10.0 years). In comparison, the third survey, which included 453 patients, showed a slightly lower 10-year native liver survival rate of 53.7%, whereas the overall survival rate marginally improved to 93.2%. The follow-up period was notably longer, averaging 5.6±3.5 years (range: 0–12.2 years), likely allowing for more comprehensive long-term outcome assessment (
Table 7).v
DISCUSSION
This study provides a comparative analysis of three nationwide surveys on BA in Korea, conducted by the KAPS, focusing on long-term trends in diagnosis, treatment, and outcomes. The findings from the third survey (2011–2021) reflect both progress and ongoing challenges in the management of BA when compared to the earlier surveys, particularly the second (2001–2010).
One of the most notable developments is the increased centralization of care. While the total number of BA patients remained stable across the second and third surveys, a growing proportion of cases were managed by a smaller number of high-volume centers. This centralization likely contributed to improved overall outcomes, including reduced mortality and follow-up loss, as specialized centers tend to offer more consistent and comprehensive care. Although the direct impact of centralization on prognosis could not be conclusively demonstrated in this study, several recent studies have shown that centralization of BA care to high-volume, specialized centers improves outcomes by enabling earlier surgical intervention, higher jaundice clearance rates, and better long-term survival [
6-
8].
The timing of surgery also showed meaningful improvement, with more patients undergoing Kasai portoenterostomy at an earlier age in the third survey. This trend aligns with international recommendations emphasizing early intervention to enhance native liver survival. A meta-analysis has demonstrated that performing the Kasai procedure before 60 days of age significantly increases the likelihood of jaundice clearance and reduces the need for LT. However, recent data from the United States indicate that the median age at surgery remains above this target, suggesting ongoing challenges in early diagnosis and referral [
9]. Furthermore, there was a substantial increase in the use of preoperative imaging, including MRCP, as well as improved diagnostic precision through liver biopsy. MRCP has proven to be a valuable non-invasive tool in diagnosing BA, offering high sensitivity and accuracy. Studies have reported MRCP sensitivities ranging from 90% to 100% and diagnostic accuracies between 71% and 100%, making it a crucial component in the diagnostic workup of suspected cases [
10]. These developments indicate a nationwide shift toward standardized diagnostic protocols and earlier identification of BA, which are essential for improving surgical outcomes and long-term prognosis.
Despite these advances, native liver survival slightly declined in the third survey (53.7%) compared to the second (59.8%), even as the overall survival modestly improved (93.2% vs. 92.9%). This paradox may be attributable to earlier referrals for LT, enhanced access to transplant services, and evolving criteria for transplant timing. In essence, while fewer patients retained their native livers long-term, more survived due to timely surgical intervention and improved post-transplant outcomes. Supporting this, Liu et al. [
11] reported that patients with BA who underwent the Kasai procedure followed by LT had significantly better overall survival compared to those who did not undergo the Kasai procedure, with a hazard ratio of 0.2 (p=0.02). However, patients with early failure of the Kasai procedure (native liver survival time <1 year) exhibited higher risks for biliary and vascular complications and cytomegalovirus infection after transplantation. These findings suggest that while early referral and transplantation can improve overall survival, they may also lead to a decrease in native liver survival rates due to the increased number of patients receiving transplants earlier in the disease course [
11]. These findings underscore the importance of balancing early surgical intervention and timely transplantation to optimize both native liver and overall survival outcomes in BA patients.
The reduction in mortality (from 6.9% to 4.9%) and decrease in follow-up loss (from 12.4% to 11.5%) between the second and third surveys further highlight the cumulative effect of advances in perioperative care, patient monitoring, and centralized data tracking. However, the increased detection of long-term complications—such as cholangitis, variceal bleeding, and hepatic failure—underscores the need for enhanced long-term follow-up protocols and multidisciplinary care even after initial surgical success. Long-term survivors with their native liver are at significant risk for complications. A study by Kelly reported that individuals with BA surviving with their native livers post-hepatoportoenterostomy are likely to develop complications in adolescence and early adulthood, including cholangitis, portal hypertension, and variceal bleeding. Cholangitis is a frequent and serious complication after hepatoportoenterostomy, with one-third of native liver survivors experiencing cholangitis in adulthood [
12]. Furthermore, a study by Takase found that patients with BA with severe liver fibrosis on follow-up liver biopsy had worse long-term survival and a higher rate of progression of complications, even though they had little or no symptoms at the time of biopsy. These results suggest that patients with severe liver fibrosis should be considered or prepared for LT according to their clinical situation and social situation of donor availability [
13]. These findings underscore the importance of lifelong monitoring and multidisciplinary management for patients with BA, even after successful initial surgical intervention.
There are limitations to this study. The first national survey (1980–2000) used different data collection methods, limiting the ability to make direct comparisons across all variables. Additionally, while the survey captured data from nearly all active pediatric surgical centers in Korea, some variations in diagnostic and treatment practices may still exist. Furthermore, long-term quality of life and developmental outcomes were not assessed, which remain important metrics for future investigations.
In conclusion, the third national survey demonstrates that while overall survival of BA patients has improved and care has become more centralized and standardized, challenges remain in optimizing native liver survival and managing long-term complications. These findings support the ongoing value of national registry-based surveillance and highlight the need for continued collaboration among pediatric hepatobiliary specialists to refine diagnostic algorithms, improve early referral systems, and enhance long-term outcomes for children with BA.
NOTES
-
Funding
This research was supported and funded by SNUH Lee Kun-hee Child Cancer & Rare Disease Project, Republic of Korea (grant number: 22C-006-0000, 23C-006-0000).
-
Conflict of Interest
No potential conflict of interest relevant to this article was reported.
-
Author Contributions
Conceptualization: J.Y.J.; Data curation: J.Y.J., K.D., K.H., K.K.H., K.D.Y., K.S.H., K.W., K.H.Y., K.H.Y., K.S.C., N.Y., N.J.M., N.S.H., P.J., P.J., P.T.J., S.T.M., S.J.Y., S.J., S.H.B., S.J., A.S.M., Y.H.B., O.J.T., O.C., Y.J.K., L.S., L.J.Y., I.K., C.H.K., J.E., C.J.H., C.Y.J., C.Y.H., C.S.J.N., H.S.J., H.I.G., H.J.W.; Formal analysis: J.Y.J., S.H.B.; Funding acquisition: J.Y.J.; Investigation: J.Y.J., S.H.B.; Methodology: J.Y.J., S.H.B.; Project administration: J.Y.J., S.H.B.; Resources: J.Y.J., K.D., K.H., K.K.H., K.D.Y., K.S.H., K.W., K.H.Y., K.H.Y., K.S.C., N.Y., N.J.M., N.S.H., P.J., P.J., P.T.J., S.T.M., S.J.Y., S.J., S.H.B., S.J., A.S.M., Y.H.B., O.J.T., O.C., Y.J.K., L.S., L.J.Y., I.K., C.H.K., J.E., C.J.H., C.Y.J., C.Y.H., C.S.J.N., H.S.J., H.I.G., H.J.W.; Writing - original draft: J.Y.J.; Writing - review & editing: J.Y.J.
Fig. 1.
Flowchart of patients with biliary atresia.
The following figure is a flowchart of BA patients, including primary LT data, representing the second survey from 2001 to 2010 and the third survey from 2011 to 2021.
BA, biliary atresia; LT, liver transplantation.

Fig. 2.
Yearly distribution of biliary atresia per 100,000 live births.
The first survey (1980–2000, blue) showed a gradual increase in patient numbers. The second survey (2001–2010, green) demonstrated relatively stable annual case numbers with a mean of 43.5 patients (n=435). The third survey (2011–2021, yellow) also showed stable trends with slight fluctuations and a mean of 41.18 patients (n=453).

Fig. 3.
Hospital distribution of biliary atresia.
Hospital distribution of biliary atresia patients in the second (2001–2010) and third (2011–2021) national surveys. The number of participating institutions decreased from 18 in the second survey to 15 in the third survey.
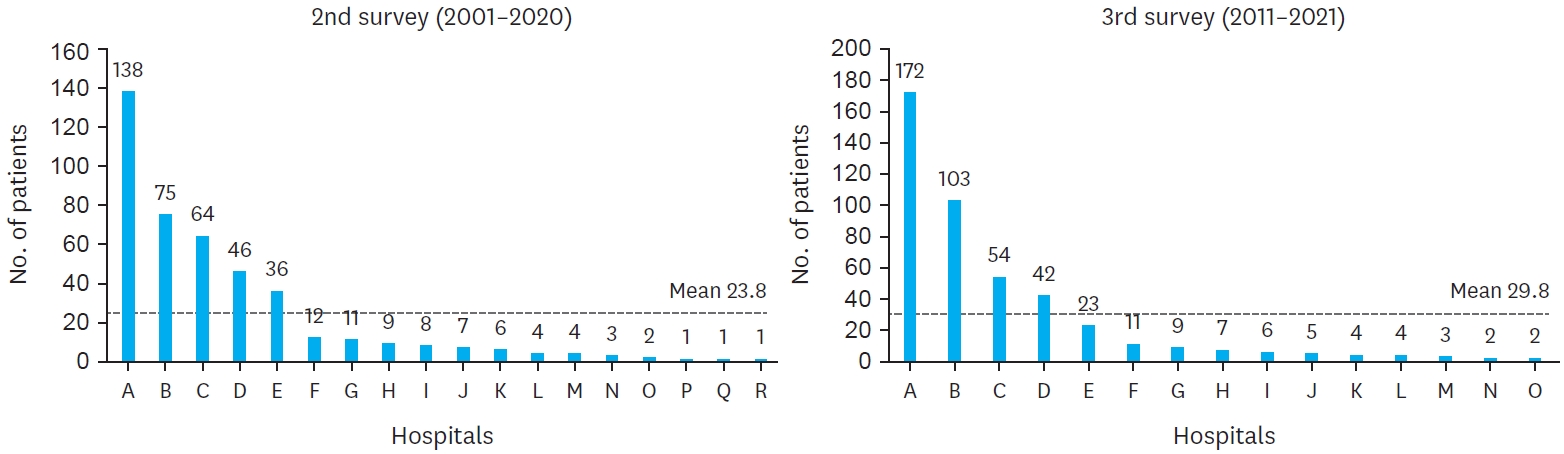
Table 1.Estimated prevalence of biliary atresia patients among live births in Korea from national surveys by the KAPS, including the 2nd (2001–2010) and 3rd (2011–2021) surveys
Table 1.
|
Year |
Total live births |
2nd survey
|
Year |
Total live births |
3rd survey
|
|
No. |
Rate (95% CI)a);
|
No. |
Rate (95% CI)a);
|
|
2001 |
559934 |
42 |
7.50 (5.23-9.77) |
2011 |
471265 |
27 |
5.73 (3.57-7.89) |
|
2002 |
496911 |
31 |
6.24 (4.04-8.43) |
2012 |
484550 |
44 |
9.08 (6.40-11.76) |
|
2003 |
495036 |
46 |
9.29 (6.61-11.98) |
2013 |
436455 |
49 |
11.23 (8.08-14.7) |
|
2004 |
476958 |
52 |
10.90 (7.94-13.87) |
2014 |
435435 |
44 |
10.10 (7.12-13.09) |
|
2005 |
438707 |
39 |
8.89 (6.10-11.68) |
2015 |
438420 |
36 |
8.21 (5.53-10.89) |
|
2006 |
451759 |
47 |
10.40 (7.43-13.38) |
2016 |
406243 |
50 |
12.31 (8.90-15.72) |
|
2007 |
496822 |
40 |
8.05 (5.56-10.55) |
2017 |
357771 |
37 |
10.34 (7.01-13.67) |
|
2008 |
465892 |
44 |
9.44 (6.65-12.23) |
2018 |
326822 |
53 |
16.22 (11.85-20.58) |
|
2009 |
444849 |
51 |
11.46 (8.32-14.61) |
2019 |
302676 |
37 |
12.22 (8.29-16.16) |
|
2010 |
470171 |
43 |
9.15 (6.41-11.88) |
2020 |
272337 |
37 |
13.59 (9.21-17.96) |
|
|
|
|
2021 |
260562 |
39 |
14.97 (10.27-19.67) |
|
Total |
4797039 |
435 |
9.07 (8.22-9.92) |
Total |
4192536 |
453 |
10.80 (9.81-11.80) |
Table 2.Patients demographics and characteristics of biliary atresia patients from national surveys by the KAPS, including the 1st (1980–2000), 2nd (2001–2010) and 3rd (2011–2021) surveys
Table 2.
|
Characters |
1980-2000 (n=320) |
2001-2010 (n=404) |
2011-2021 (n=453) |
|
Sex (M/F ratio) |
0.77 |
0.68 |
0.7 |
|
Gestational age (wk) |
- |
38.8±1.7 |
38.4±2.0 |
|
Mean birth weight (kg) |
- |
3.08±0.47 |
3.05±0.53 |
|
Apgar score |
|
|
|
|
1 min |
|
|
7.28±2.06 |
|
5 min |
|
|
8.46±1.71 |
|
10 min |
|
|
9.00±0.83 |
|
Mean maternal age |
|
|
32.93±4.89 |
|
Mean paternal age |
|
|
35.87±5.12 |
|
Associated anomaly |
72 (22.5) |
66 (16.3) |
49 (10.8) |
|
CNS |
- |
- |
3 (0.66) |
|
Cardiovascular |
19 (5.9) |
34 (8.42) |
31 (6.84) |
|
Pulmonary |
- |
- |
3 (0.66) |
|
Gastrointestinal |
20 (6.25) |
24 (5.94) |
12 (2.65) |
|
Genitourinary |
- |
20 (4.95) |
- |
|
Chromosomal |
- |
- |
3 (0.66) |
|
Splenic malformation |
9 (2.81) |
7 (1.73) |
7 (1.55) |
|
Biliary anomalies |
- |
- |
5 (1.10) |
|
Others |
19 (6.19) |
25 (6.19) |
- |
Table 3.Preoperative clinical findings of biliary atresia patients from national surveys by the KAPS, including the 1st (1980–2000), 2nd (2001–2010) and 3rd (2011–2021) surveys
Table 3.
|
Characters |
1980-2000 (n=320) |
2001-2010 (n=404) |
2011-2021 (n=453) |
|
Symptoms |
|
|
|
|
Jaundice |
370 (98.4) |
381 (94.3) |
417 (92.1) |
|
Acholic stool |
324 (86.2) |
251 (62.1) |
299 (66.0) |
|
Hepatomegaly |
182 (48.4) |
31 (7.7) |
26 (5.8) |
|
Abdominal distension |
88 (24.4) |
26 (6.44) |
No check |
|
Dark urine |
No check |
No check |
29 (6.4) |
|
Other |
10 (2.7) |
20 (5.0) |
No check |
|
Lab finding on admission |
|
|
|
|
Bilirubin, total (mg/dL) |
- |
10.1±3.6 |
8.7±2.9 |
|
Bilirubin, direct (mg/dL) |
- |
6.7±2.4 |
6.2±2.2 |
|
GGT (IU/L) |
- |
553.6±521.9 |
473.8±354.7 |
|
AST (IU/L) |
- |
246.8±204.9 |
204.0±179.1 |
|
ALT (IU/L) |
- |
165.7±131.0 |
140.2±115.5 |
|
Preoperative diagnosis |
|
|
|
|
US |
- |
391 (96.8) |
442 (97.6) |
|
Hepatobiliary scan |
- |
275 (68.1) |
320 (70.6) |
|
MRCP |
- |
182 (45.0) |
278 (61.4) |
|
Liver biopsy |
- |
109 (27.1) |
134 (29.6) |
Table 4.Operative findings of biliary atresia patients from national surveys by the KAPS, including the 1st (1980–2000), 2nd (2001–2010) and 3rd (2011–2021) surveys
Table 4.
|
Characters |
1980-2000 |
2001-2010 |
2011-2021 |
|
Age on operation |
375 |
426 |
453 |
|
Mean (day) |
74.8±37.3 |
66.2±28.7 |
61.0±27.4 |
|
Median (day) |
- |
64 (10-235) |
62 (6-199) |
|
≤30 |
- |
32 (7.5) |
63 (13.9) |
|
31-60 |
- |
152 (35.7) |
154 (34.0) |
|
61-90 |
- |
195 (45.8) |
191 (42.2) |
|
91-120 |
- |
28 (6.6) |
33 (7.3) |
|
>120 |
- |
19 (4.5) |
12 (2.7) |
|
Operative cholangiogram |
- |
397 |
446 |
|
Yes |
- |
210 (52.9) |
320 (71.7) |
|
Type of biliary atresia |
251 |
350 |
385 |
|
l/l-cyst |
18 (7.17) |
7 (2.0) |
52 (13.5) |
|
II |
19 (7.56) |
29 (8.3) |
56 (14.5) |
|
III |
214 (85.3) |
314 (89.7) |
277 (71.9) |
|
Liver pathology |
249 |
321 |
- |
|
Fibrosis, minimal |
70 (28.1) |
89 (27.7) |
- |
|
Fibrosis, moderative |
104 (41.8) |
135 (42.1) |
- |
|
Fibrosis, severe/cirrhosis |
75 (30.1) |
97 (30.2) |
- |
|
Size of microscopic duct |
165 |
319 |
152 |
|
Absent |
14 (8.5) |
73 (22.9) |
4 (2.6) |
|
≤150 um |
50 (30.3) |
133 (41.7) |
93 (61.2) |
|
>150 um |
101 (61.2) |
113 (35.4) |
55 (36.2) |
|
Type of reconstruction |
359 |
402 |
446 |
|
Original Roux-en-Y (Kasai I) |
276 (76.9) |
401 (99.8) |
434 (97.3) |
|
Roux-en Y with valve |
60 (16.7) |
0 |
4 (0.9) |
|
Double Roux-en-Y (Kasai II) |
2 (0.6) |
0 |
0 |
|
Gallbladder Kasai |
9 (2.5) |
0 |
0 |
|
Double enterostomy (Suruga II) |
1 (0.3) |
0 |
0 |
|
Hepatic portoduodenostomy |
0 |
1 (0.2) |
2 (0.4) |
|
Others |
4 (1.1) |
1 (0.2) |
6 (1.3) |
|
Operation time (min) |
- |
- |
255.5±64 |
Table 5.Postoperative findings of biliary atresia patients from national surveys by the KAPS, including the 2nd (2001–2010) and 3rd (2011–2021) surveys
Table 5.
|
Characters |
2001-2010 |
2011-2021 |
|
Discharge date (POD) |
31.5±26.1 (8-173) |
29.2±18.0 (2-195) |
|
1st time to feed (POD) |
- |
4.14±1.93 |
|
Day of 1st bile stained stool |
- |
6.43±5.72 |
|
Discharge medication |
404 |
437 |
|
Oral antibiotics |
292 (72.3) |
247 (54.53) |
|
Oral steroid |
165 (40.8) |
239 (52.76) |
|
UDCA |
376 (93.1) |
430 (94.92) |
|
Phenobabital |
78 (19.2) |
134 (29.6) |
|
Tocopherol |
70 (17.2) |
220 (48.6) |
|
Alvityl |
41 (10.1) |
372 (82.1) |
|
Re-admission |
435 |
447 |
|
Yes |
269 (61.8) |
308 (68.9) |
|
Cause (multiple responses) |
|
|
|
Cholangitis |
215 (79.9) |
267 (59.7) |
|
Varices |
55 (20.4) |
34 (7.6) |
|
Ascites |
31 (11.5) |
27 (6.0) |
|
Others |
43 (16.0) |
31 (6.9) |
|
Redo-operation |
5 (1.1) |
12 (2.7) |
|
Late complication |
307 |
446 |
|
Yes |
216 (70.4) |
220 (49.3) |
|
Cause (multiple responses) |
|
|
|
Cholangitis episode during follow-up |
171 (55.7) |
147 (33.0) |
|
Ascites |
29 (9.4) |
- |
|
Variceal bleeding |
26 (8.5) |
44 (9.9) |
|
Nutritional problem |
10 (3.3) |
7 (1.6) |
|
Liver cirrhosis/failure |
9 (2.9) |
125 (28.0) |
|
CMV infection |
- |
31 (7.0) |
|
Others |
14 (4.6) |
17 (3.8) |
Table 6.Follow-up after Kasai operation of biliary atresia patients from national surveys by the KAPS, including the 1st (1980–2000), 2nd (2001–2010) and 3rd (2011–2021) surveys
Table 6.
|
Characters |
1980-2000 |
2001-2010 |
2011-2021 |
|
Kasai only |
- |
276/435 (63.4) |
290/453 (64.0) |
|
Alive |
195 |
205 (74.3) |
229 (79.0) |
|
Without problem |
110 |
124 |
102 |
|
With problem |
85 |
81 |
127 |
|
Death |
- |
18 (6.5) |
9 (3.1) |
|
Follow-up loss |
- |
53 (19.2) |
52 (11.5) |
|
Liver transplantation |
- |
159/435 (36.6) |
163/453 (36.0) |
|
Interval from Kasai operation (yr) |
- |
1.1±1.3 (0-7.1) |
1.6±1.9 (0-10.9) |
|
Alive |
24 |
146 (91.8) |
150 (92.0) |
|
Without problem |
3 |
106 |
71 |
|
With problem |
18 |
40 |
79 |
|
Not mentioned |
3 |
0 |
0 |
|
Death |
- |
12 (7.5) |
13 (8.0) |
|
Follow-up loss |
- |
1 (0.6) |
0 |
|
Total death |
83 (27.4) |
30 (6.9) |
22 (4.9) |
|
Total follow-up loss |
74 (19.7) |
54 (12.4) |
52 (11.5) |
Table 7.Postoperative survival rate of biliary atresia patients from national surveys by the KAPS, including the 2nd (2001–2010) and 3rd (2011–2021) surveys
Table 7.
|
Characters |
2001-2010 |
2011-2021 |
|
Survival rate after Kasai operation |
435 |
453 |
|
Native liver survival rate for 10 yr |
0.598 |
0.537 |
|
Overall survival rate for 10 yr |
0.929 |
0.932 |
|
Postoperative follow-up period (yr) |
3.4±2.8 (0-10.0) |
5.6±3.5 (0-12.2) |
REFERENCES
- 1. Sasaki H, Tanaka H, Nio M. Current management of long-term survivors of biliary atresia: over 40 years of experience in a single center and review of the literature. Pediatr Surg Int 2017;33:1327-33.
- 2. Lin YC, Chang MH, Liao SF, Wu JF, Ni YH, Tiao MM, et al. Decreasing rate of biliary atresia in Taiwan: a survey, 2004-2009. Pediatrics 2011;128:e530-6.
- 3. Chiu CY, Chen PH, Chan CF, Chang MH, Wu TC; Taiwan Infant Stool Color Card Study Group. Biliary atresia in preterm infants in Taiwan: a nationwide survey. J Pediatr 2013;163:100-3.e1.
- 4. Choi KJ, Kim SC, Kim SK, Kim WK, Kim IK, Kim JE, et al. Biliary atresia in Korea: A Survey by the Korean Association of Pediatric Surgeons. J Korean Assoc Pediatr Surg 2002;8:143-55.
- 5. Oh J, Kim D, Kim S, Kim I, Kim H, Kim HY, et al. Biliary atresia -a survey by the Korean Association of Pediatric Surgeons in 2011-. J Korean Assoc Pediatr Surg 2013;19:1-13.
- 6. Davenport M, Makin E, Ong EG, Sharif K, Dawrant M, Alizai N. The outcome of a centralization program in biliary atresia: twenty years and beyond. Ann Surg 2025;281:608-14.
- 7. Mesas Burgos C, Gatzinsky V, Nord P, Gustafson E, Stenström P, Winberg H, et al. Impact of centralization of care for patients with congenital diaphragmatic hernia in Sweden. J Pediatr Surg 2025;60:162314.
- 8. Madadi-Sanjani O, Fortmann D, Rolle U, Rodeck B, Sturm E, Pfister ED, et al. Centralization of biliary atresia: has Germany learned its lessons? Eur J Pediatr Surg 2022;32:233-9.
- 9. Gutierrez JV, Johnson L, Desai K, Tabak B, Woo RK. Timing of Kasai procedure for biliary atresia: an analysis of the pediatric national surgical quality improvement program database. J Surg Res 2024;301:681-5.
- 10. Sung S, Jeon TY, Yoo SY, Hwang SM, Choi YH, Kim WS, et al. Incremental value of MR cholangiopancreatography in diagnosis of biliary atresia. PLoS One 2016;11:e0158132.
- 11. Liu L, Wei L, Qu W, Liu Y, Zeng Z, Zhang H, et al. Impact of the Kasai procedure and the length of native liver survival time on outcomes of liver transplantation for biliary atresia. Liver Transpl 2022;28:224-35.
- 12. Kelly D, Samyn M, Schwarz KB. Biliary atresia in adolescence and adult life: medical, surgical and psychological aspects. J Clin Med 2023;12:1594.
- 13. Takase K, Ueno T, Matsumoto S, Uga N, Deguchi K, Nomura M, et al. Impact of follow-up liver biopsy on long-term outcomes post-Kasai procedure in patients with biliary atresia. Pediatr Surg Int 2025;41:88.

 , Dayoung Ko2, Hyunhee Kwon2, Ki Hoon Kim2, Dae Yeon Kim2, Soo-Hong Kim2, Wontae Kim2, Hae-Young Kim2, Hyun Young Kim2, Seong Chul Kim2, Younghyun Na2, Jung-Man Namgoong2, So Hyun Nam2, Junbeom Park2, Jinyoung Park2, Tae-Jun Park2, Jeong-Meen Seo2, Ji-Young Sul2, Joonhyuk Son2, Hyun Beak Shin2, Joohyun Sim2, Soo Min Ahn2, Hee Beom Yang2, Jung-Tak Oh2, Chaeyoun Oh2, Joong Kee Youn2, Sanghoon Lee2, Ju Yeon Lee2, Kyong Ihn2, Hye Kyung Chang2, Eunyoung Jung2, Jae Hee Chung2, Yu Jeong Cho2, Yun Mee Choe2, Soo Jin Na Choi2, Seok Joo Han2, In Geol Ho2, Ji-Won Han2